

In the competitive world of nonprofit fundraising, every click counts. Donation pages serve as the critical gateway between a visitor’s interest and their decision to contribute. Yet, many organizations struggle to convert site visits into donations effectively. One of the most powerful tools to bridge this gap is heat map analysis—a method that visually reveals how users interact with donation pages. By understanding user behavior through heat maps, nonprofits can optimize their pages to create seamless, engaging experiences that drive higher conversion rates.
This guide explores the ins and outs of heat map analysis for donation pages, highlighting key areas to focus on, best practices for optimization, and real-world success stories. Whether you’re new to heat maps or looking to refine your approach, this comprehensive overview will equip you with actionable insights to enhance your fundraising efforts.
What Is Heat Map Analysis and Why Does It Matter?
Heat map analysis is a data visualization technique that tracks and displays user interactions on a webpage. It highlights where visitors click, hover, and scroll, using color gradients to indicate areas of high and low engagement. For donation pages, this means nonprofits can see exactly which elements attract attention and which cause friction.
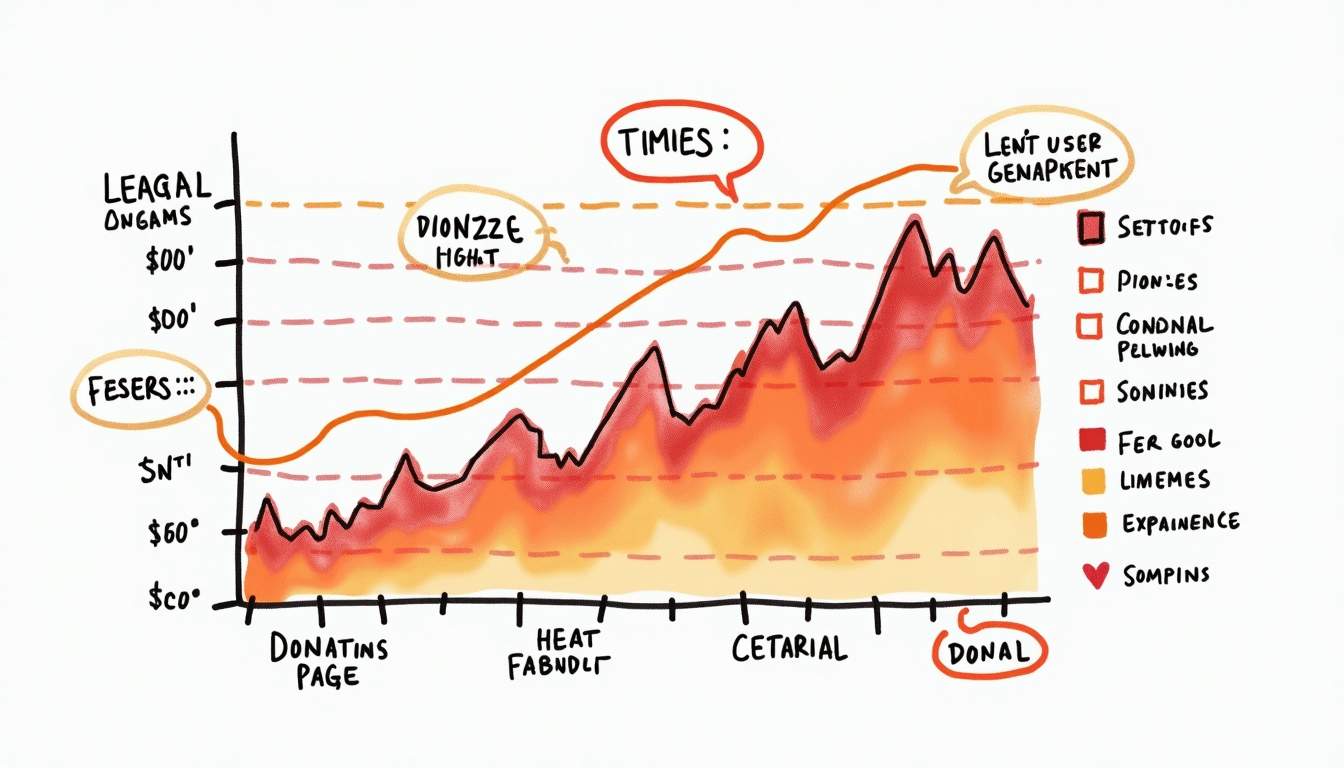
Understanding these user behaviors is crucial because it enables organizations to make informed design decisions rather than relying on guesswork. For example, a case study by QuickCreator showed that implementing AI-driven heat map analysis led to a 25% increase in conversion rates for Live Media Crew by pinpointing design elements that needed adjustment. This kind of insight can dramatically improve the effectiveness of donation pages, turning more visitors into donors.
Moreover, heat map analysis can uncover patterns in user behavior that may not be immediately obvious. For instance, it can reveal whether users are more inclined to click on images or text, or if they tend to abandon the page at a specific point in the donation process. This granular level of detail allows nonprofits to tailor their messaging and layout to better align with user preferences, thereby enhancing the overall user experience. By adjusting elements such as button placement, color schemes, or even the wording of calls to action, organizations can create a more intuitive and engaging donation process.
In addition to improving conversion rates, heat map analysis also serves as a valuable tool for A/B testing. Nonprofits can experiment with different designs or content strategies and use heat maps to visualize the impact of these changes in real-time. This iterative approach not only fosters a culture of continuous improvement but also ensures that resources are allocated efficiently, focusing on strategies that yield the highest engagement. As a result, organizations can maximize their fundraising potential while minimizing wasted effort on ineffective designs.
Key Areas to Analyze on Donation Pages
Call-to-Action (CTA) Buttons
The CTA button is the centerpiece of any donation page. Its placement, color, size, and wording can significantly influence whether a visitor decides to donate. Heat maps reveal whether users notice the CTA and how often they interact with it.
For instance, if a heat map shows that users frequently scroll past the CTA or hesitate to click, it may indicate that the button is not prominent enough or that the messaging lacks urgency. Nonprofits should experiment with contrasting colors, concise and compelling text, and strategic placement—ideally above the fold—to maximize visibility and clicks. Additionally, incorporating action-oriented phrases such as “Join Us in Making a Difference” or “Your Gift Matters” can create a sense of urgency and personal connection, prompting users to take immediate action.
Form Fields and User Flow
Donation forms are often the final hurdle before a visitor completes their contribution. Heat map data can uncover which fields users engage with and where they abandon the process. Lengthy or complicated forms can deter potential donors, increasing drop-off rates.
Optimizing form fields by reducing unnecessary questions and simplifying the layout can improve completion rates. For example, if heat maps show users repeatedly skipping or hesitating on certain fields, consider making those optional or removing them altogether. Streamlining the donation process makes it easier and faster for users to give. Furthermore, implementing autofill options for returning donors can enhance user experience, as it reduces the time spent filling out forms and encourages repeat contributions.
Content Placement and Emotional Engagement
Donation pages are not just transactional—they need to build trust and emotional connection. Heat maps help identify which content areas draw attention, such as impactful images, testimonials, or stories of beneficiaries.
Strategically placing these elements where users naturally focus their attention can enhance engagement. For example, placing a heartfelt testimonial near the CTA button can reinforce the visitor’s motivation to donate. Conversely, if heat maps reveal that important content is being ignored because it’s too far down the page, consider repositioning it higher up to ensure visibility. Additionally, incorporating video content that showcases the impact of donations can further engage visitors, as visual storytelling often resonates more deeply than text alone. Highlighting specific projects or beneficiaries can create a narrative that draws users in, making them feel a part of the mission and more likely to contribute.
Best Practices for Optimizing Donation Pages Using Heat Map Insights
Prioritize Mobile Optimization
With nearly 45% of online donations now made via mobile devices, ensuring your donation page is mobile-friendly is essential. Heat map analysis can uncover mobile-specific issues such as small touch targets, difficult navigation, or content that requires excessive scrolling.
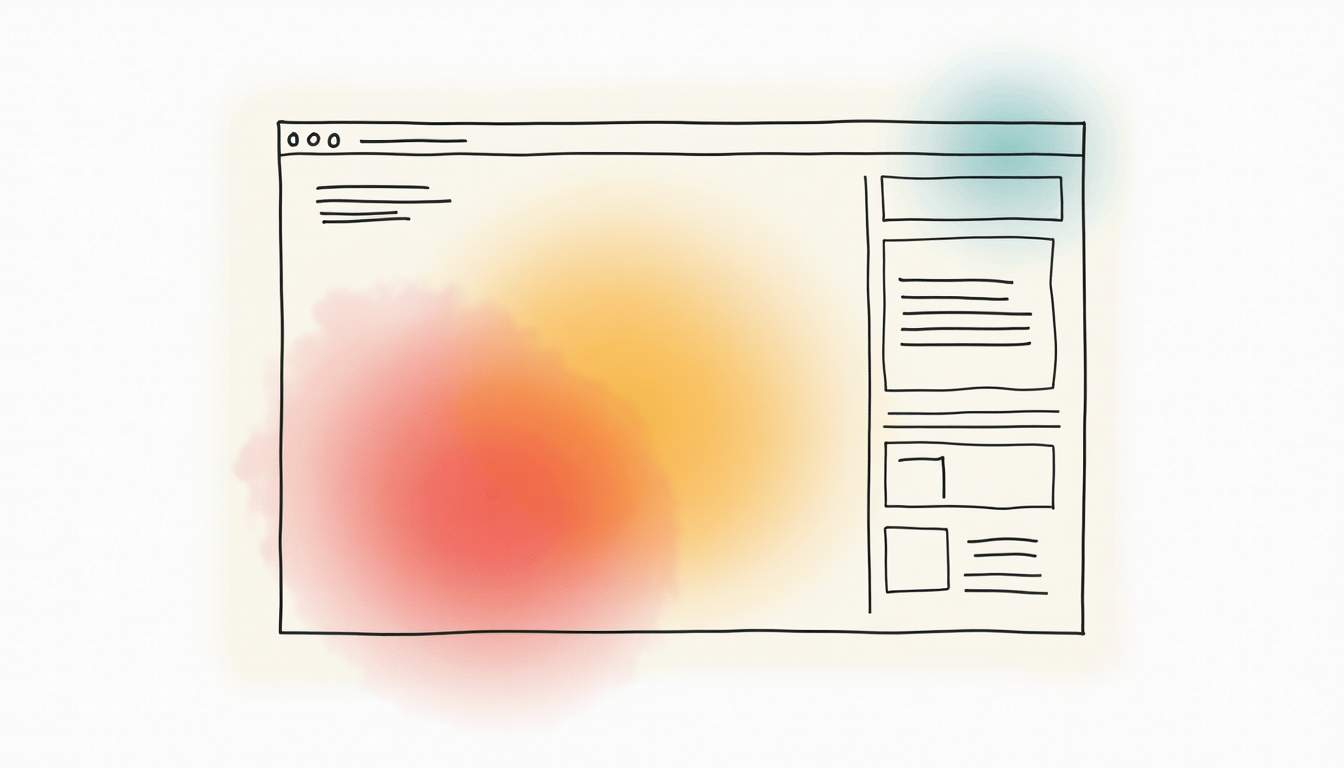
By addressing these pain points, nonprofits can create smoother mobile experiences that encourage donations. For example, increasing button sizes for easier tapping or simplifying the form layout for smaller screens can significantly boost mobile conversion rates.
Leverage Personalized User Experiences
Heat maps provide valuable insights into different audience segments’ behaviors. Using this data, nonprofits can tailor donation pages to resonate with specific groups, whether by adjusting messaging, imagery, or suggested donation amounts.
Personalization can increase engagement by making visitors feel understood and valued. For instance, returning donors might see a thank-you message or impact update, while first-time visitors could be guided through an introductory story about the organization’s mission.
Implement A/B Testing for Continuous Improvement
Heat map analysis should be part of an ongoing optimization strategy. Using insights from heat maps, nonprofits can design A/B tests to compare different versions of page elements, such as CTA buttons, headlines, or images.
Continuous testing allows organizations to identify what truly works for their audience and refine their donation pages accordingly. This iterative approach ensures that improvements are data-driven and effective, rather than based on assumptions.
Top Tools for Heat Map Analysis in Nonprofit Fundraising
Several tools offer robust heat map capabilities tailored to nonprofit needs:
- Lucky Orange: Combines heatmaps, session recordings, and form analytics to provide a comprehensive view of user behavior, helping nonprofits optimize their donation funnels effectively.
- SuperAGI: Utilizes AI-driven heat map analysis to detect user engagement patterns and recommend design improvements, making it easier to implement data-backed changes.
- FundsforNGOs: Offers guidance and case studies on using heat maps specifically for NGO websites, helping organizations understand how to apply these insights to increase donations.
Choosing the right tool depends on your organization’s size, budget, and technical expertise, but investing in heat map technology can yield substantial returns in donation conversions.
Real-World Success Stories
Charity: Water’s Mobile Donation Optimization
Charity: Water faced challenges with mobile users abandoning their donation form. By implementing heat map tools to identify where users dropped off, they redesigned their mobile donation experience. This targeted approach resulted in a 20% increase in completed donations, demonstrating the power of heat map insights in improving mobile usability.

The American Red Cross’s Scroll Map Redesign
The American Red Cross used scroll maps—a type of heat map showing how far users scroll down a page—to redesign their landing pages. By ensuring critical content appeared above the fold, they increased user engagement by 35%. This case highlights the importance of content placement and how heat maps can guide effective layout decisions.
Ethical Considerations and Data Privacy
While heat map analysis offers valuable insights, nonprofits must prioritize user privacy and comply with data protection regulations such as GDPR and CCPA. It is essential to anonymize data and use it solely to enhance user experience and fundraising outcomes.
Transparency with donors about data collection practices fosters trust and aligns with ethical standards. Ensuring that heat map tools do not capture personally identifiable information protects both users and the organization.
Conclusion
Optimizing donation pages through heat map analysis empowers nonprofits to make data-driven decisions that enhance user experience and boost conversion rates. By focusing on critical areas such as CTA effectiveness, form simplicity, content placement, and mobile responsiveness, organizations can create donation pages that truly resonate with visitors.
Leveraging the right tools and continuously testing improvements based on heat map insights ensures that donation pages evolve to meet donor expectations. Real-world examples from organizations like Charity: Water and The American Red Cross demonstrate the tangible benefits of this approach.
In an increasingly digital fundraising landscape, heat map analysis is not just a luxury but a necessity for nonprofits aiming to maximize their impact and achieve their fundraising goals.
For further reading and to explore heat map tools, visit SuperAGI’s insights on AI heat map technology and FundsforNGOs’ guide on heatmaps for NGOs.
Ready to take your nonprofit’s digital presence to the next level? BlueWing is here to help you harness the power of paid social media and search to amplify your impact. With our expertise in the Google Ad Grants program and a commitment to sustainable growth, we’re the partners you need to outperform industry benchmarks and keep you informed every step of the way. Contact us today and let’s build a stronger future together.


